
First Look
This page gives an explanation and examples of the data.
Delay Doppler Maps
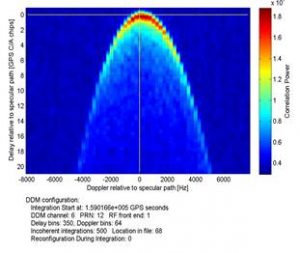
The received signals are mapped in the delay and Doppler domains to capture the effect of the reflection on the signals in a “Delay Doppler Map” (DDM). When the sea is smoother, more of the signal’s energy (or correlation power) is contained in the peak, while under rougher conditions, more of the energy is spread out away from the peak with increasing delay and Doppler.
The SGR-ReSI is able to collect reflections from up to four different GPS satellites simultaneously. Signals are only received if the reflection specular point is within the nadir antenna footprint of the SGR-ReSI on TechDemoSat-1. This has a circular field of view of approximately 30° diameter half power width (45° for 6 dB down) and is approx. 6° off-pointing from nadir, pointing away from satellite velocity direction.
A video showing the first measurements from TechDemoSat-1 GNSS Receiver below:
The video shows in about 20 times real time speed the motion of the TechDemoSat-1 satellite over an orbit, indicated by a white cross on the world map. The specular reflections targeted by the SGR-ReSI are shown by yellow spots, and the measurement tracks are shown in yellow. The four Delay Doppler Map channels from the SGR-ReSI are shown at the top right. The spreading horseshoe shape is caused by reflections being received away from the specular point, and a rougher ocean causes more spreading. When reflections are received from over land and over ice, there is much less spreading. The red band on the map indicates the collection of “raw” unprocessed data, which takes a few minutes to transfer before the processed Delay Doppler Maps resume.
About the Data
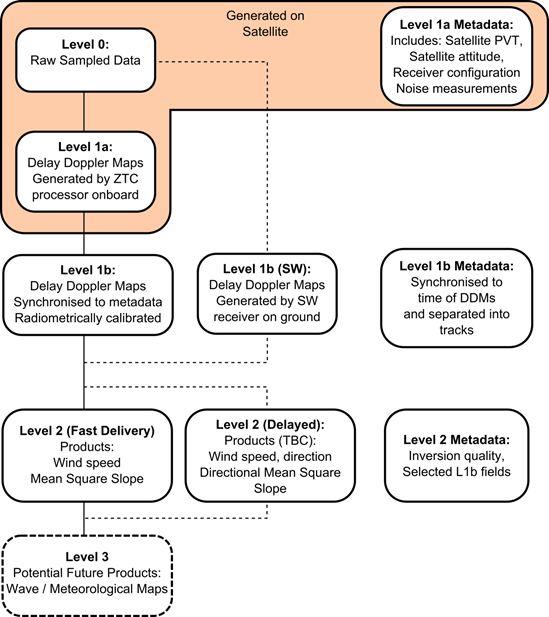
The data from the experiment is categorised at different levels of processing.
Level 0: contains data directly sampled from the front-ends. These collections are only available when specially scheduled by the operator, and are limited to a duration of around 2 minutes by the on-board storage.
Level 1a: contains data that is processed on-board the satellite into Delay Doppler Maps, and the lower data rate permits it to be gathered continuously.
Level 1b: This contains the Level 1a DDM data that have been repackaged into multi-frame *.tiff files. They are accompanied by Level 1b meta-data that have been synchronised to match the DDMs.
Level 2: contains data that have been inverted from Level 1b into geophysical measures initially comprising wind speed and mean square slope.
The MERRByS catalogue gives access to Level 1b and Level 2 data.